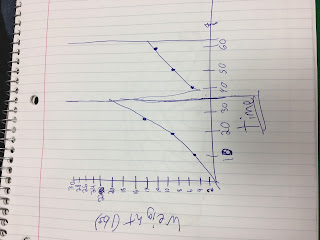
To present the graphs we would divide everything into increments of 2 for weight and 10 for time. At 30 minutes we replaced the bag which reset the graph back down to 0 to then continue adding food.
Initial Analytics
In the beginning we saw a steady growth of food being wasted with all in all a steady pattern of people coming. At 30 minutes 66 people came and there was about 15 and a half pounds of food waste, which does not seem like a lot but it is.


Interesting to see how your data collection differed from ours. How do you think we could reduce that amount of waste down to something more manageable and healthy for the environment?
ReplyDeleteTo reduce waste, I think we should serve food in small portions to each student instead of letting them take whatever they want. I know at Penn State they do this, and it encourages you to eat everything on your plate because of the smaller portions
DeleteWhat food was most commonly thrown out?
ReplyDeleteSalad definitely was up there and pasta
DeleteHow much food was thrown out?
ReplyDeleteTotal food waste was 28.6 pounds in an hour.
Delete